LLM Commentary for Graph Understanding
Interactive graph visualization system to query graphs using natural language, providing LLM explanations and significance scores for query terms.
More About the Project
Python | Dash | Plotly | Pandas | Ollama
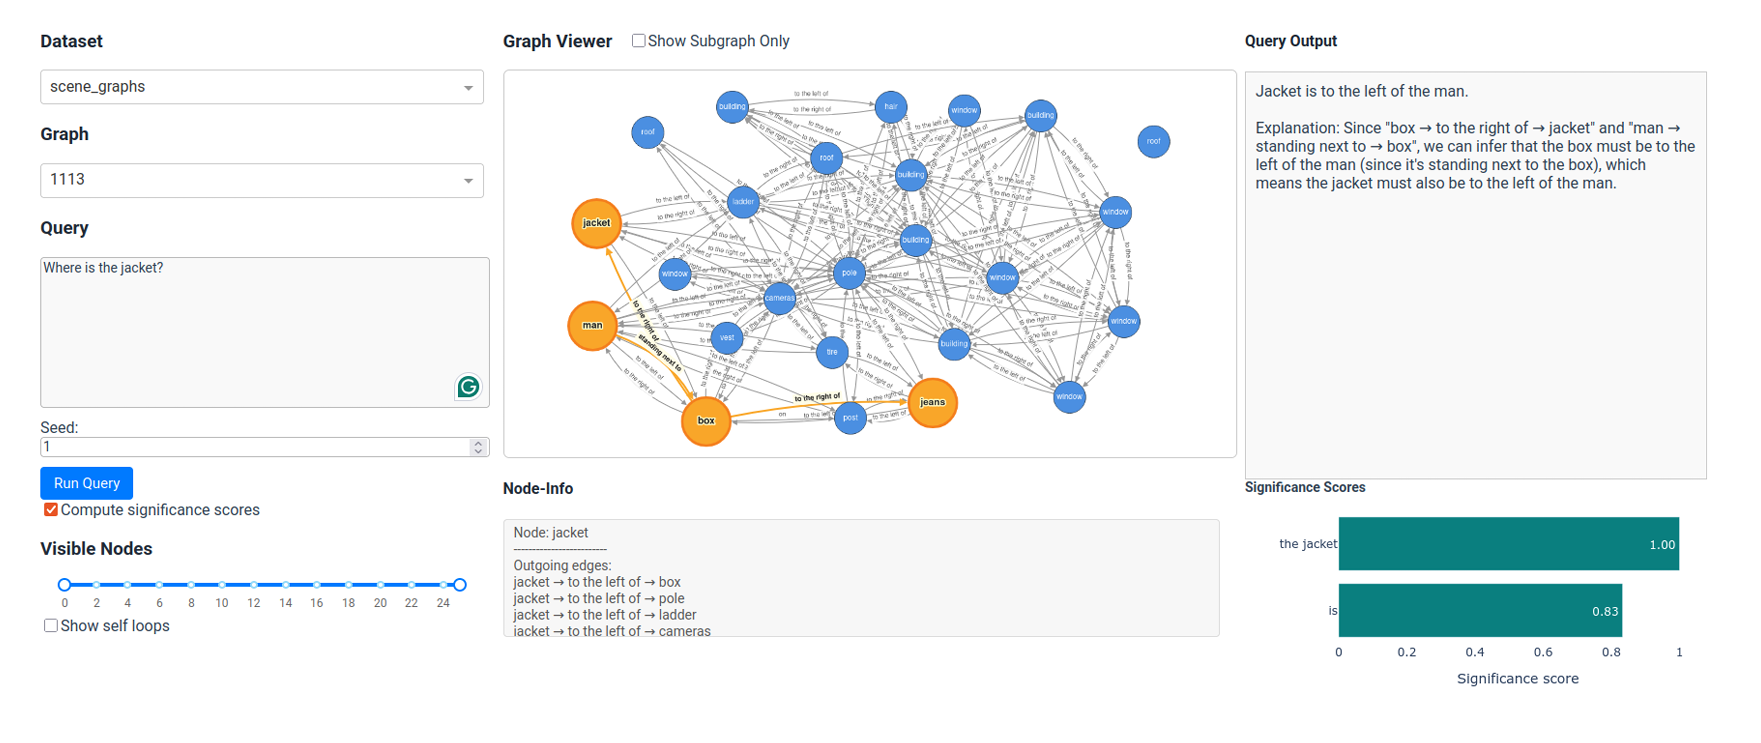
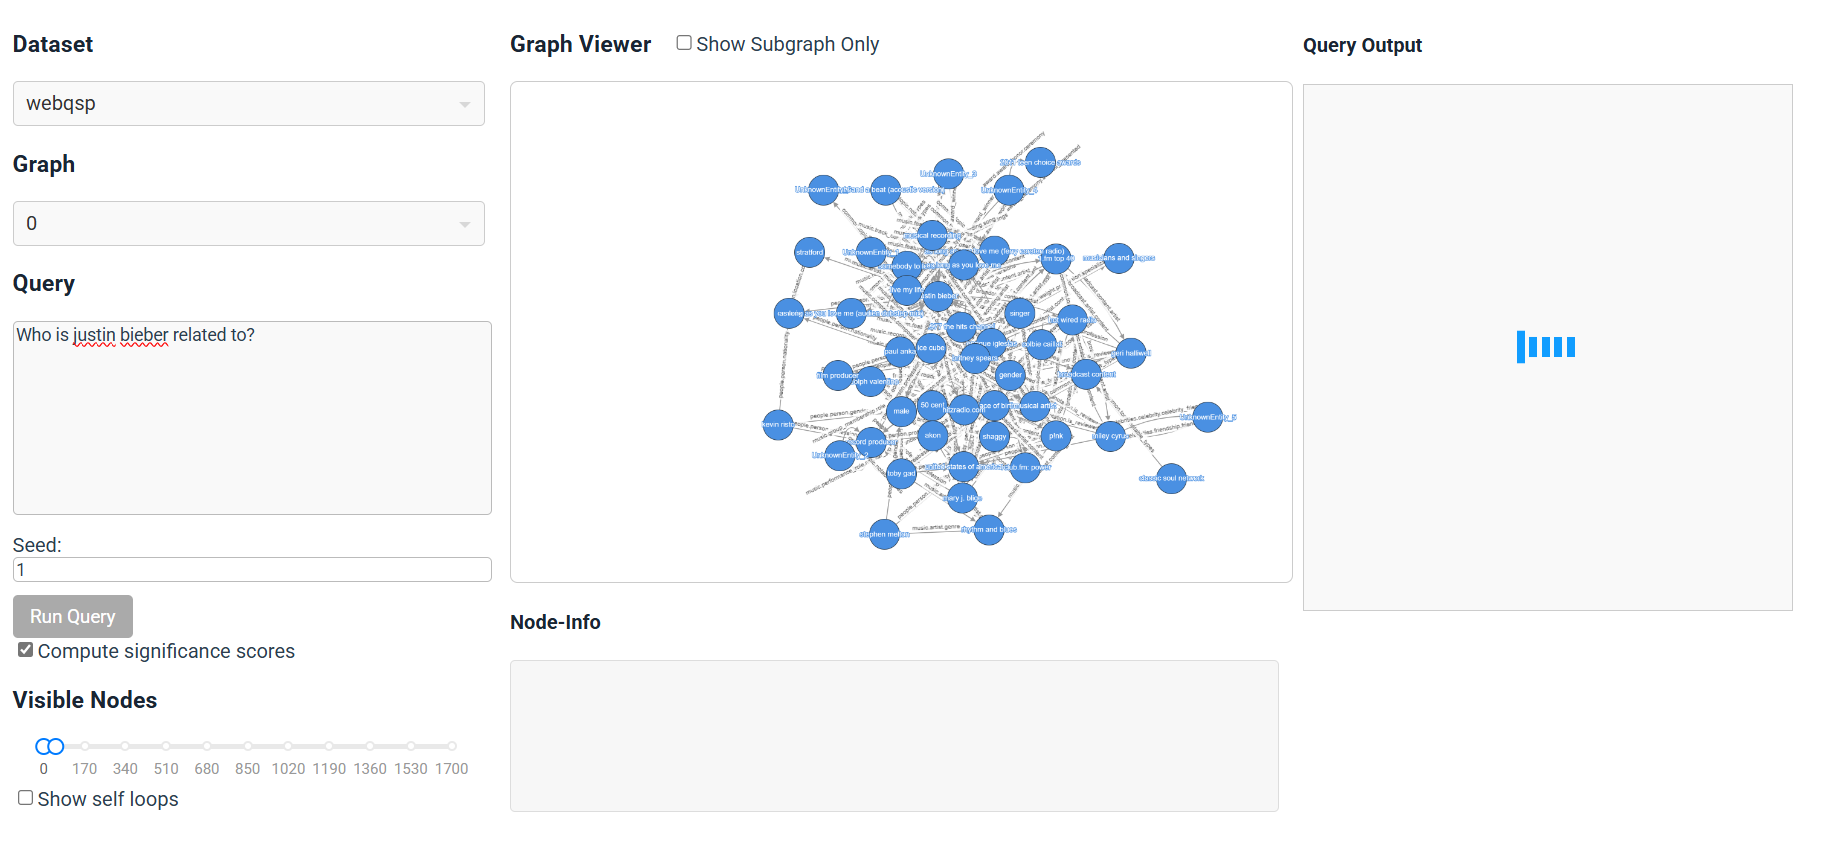
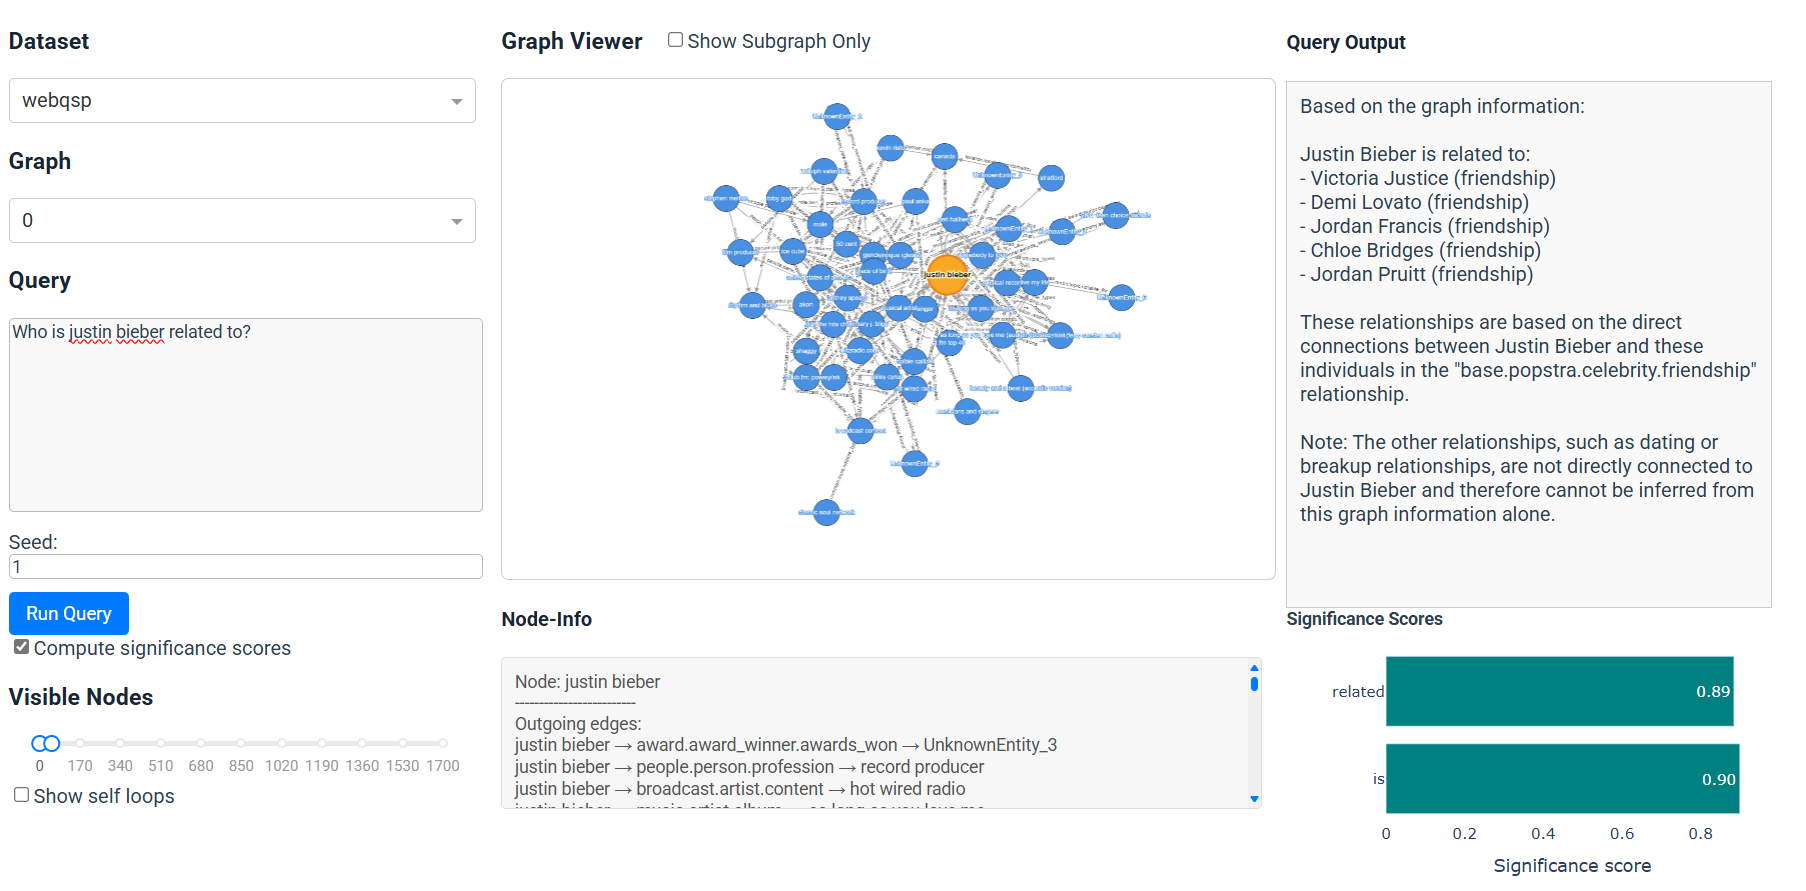
The system proposes an interactive, user-friendly visual interface, allowing users to retrieve graphs using natural language queries. It enhances interpretability by providing comprehensive explanations from the LLM and offering phrase-level feedback (significance scores) on how influential noun, verb, and preposition phrases were in generating the resulting subgraph.
Visual Interface Screenshots
Technical Report
My Contributions
Interactive Interface Development
Developed an interactive and user-friendly visual system for natural language graph querying using Dash and Plotly.
Visualized the original graphs and their retrieved subgraphs in the interface’s center part.
Query Interpretability & Feedback
Implemented phrase-level feedback over the user’s query by providing significance scores to show how relevant a phrase was for retrieving the subgraph.
Integrated the significance score calculation using an entity-level perturbation strategy and the Jaccard similarity between the original and perturbed subgraphs.
LLM Integration & Explanation
Utilized an LLM (Llama3.2:3b via Ollama) to answer user queries based on the retrieved subgraph.
Provided an explanation alongside the generated answer, detailing how the LLM arrived at its conclusion.
Data Analysis and Interpretation
Developed a novel method for phrase-level feedback by calculating significance scores for query terms to enhance model interpretability.
Employed the Entity-level Perturbation strategy to modify queries and determine the influence of specific lexical units on subgraph retrieval.
Quantified entity influence by calculating the similarity (using Jaccard index concept) between the original and perturbed subgraphs.